Page History
...
- Creating a new object within the system.
- Viewing a specific set of information.
- Going throu a standard process like taking samples.
Quick Guide
Creation Guide
This is a step-by-step guide for the selection of primary and secondary actions:
- Define the user goal for the application. What would the user primarily want to achieve within this application? Look at the requirements for information.
- Define the purpose of this dashboard. What action on this dashboard does the user need to take to achieve his primary goal? If multiple actions are may bee needed for this process, choose the final action on this dashboard.
- Define the visualization for the primary action. What boardlet contains the primary action? Select the type of action – toolbar, footerbar, content action – for the primary action.
- Select secondary actions for the dashboard. What actions fundamentally support or change the user flow? A dashboard should avoid having more than three secondary actions.
- Validate the result. Is the user flow clear to the users? Test or discuss the design with users and developers.
Example User Flow - Viewing Data
The This example applications application overlooks a large storehouse with many different containers. These containers are constenty constantly filled with some kind of building materials. The amount of this material is constantly chnaging changing as it gets used and refilled. The application tracs, among other things, these containers and the material they contain. The user wants to look at the fluctuation of material within one or multiple containers.a container and be able to edit it.
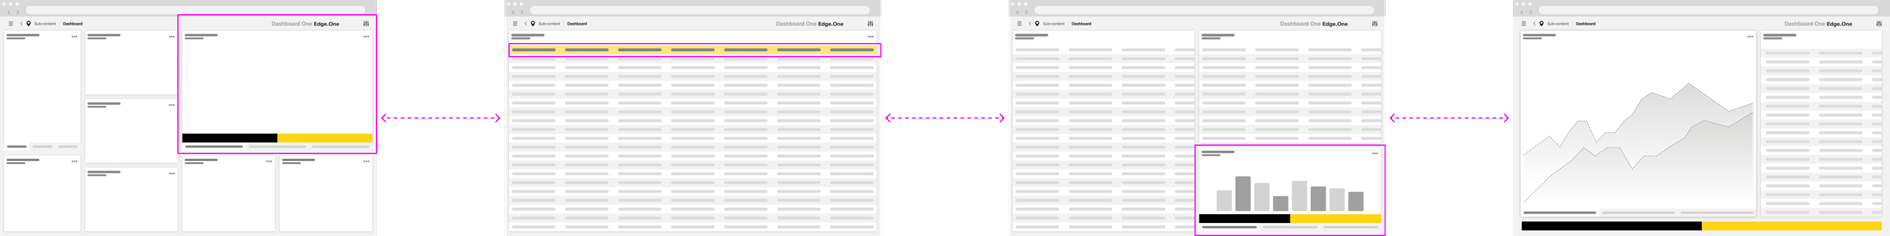
The first dashboard shows the home screen of the storage terminal. The main task for this terminal would be to survey the containers and material. Thereby the primary action leads to a list of containers.
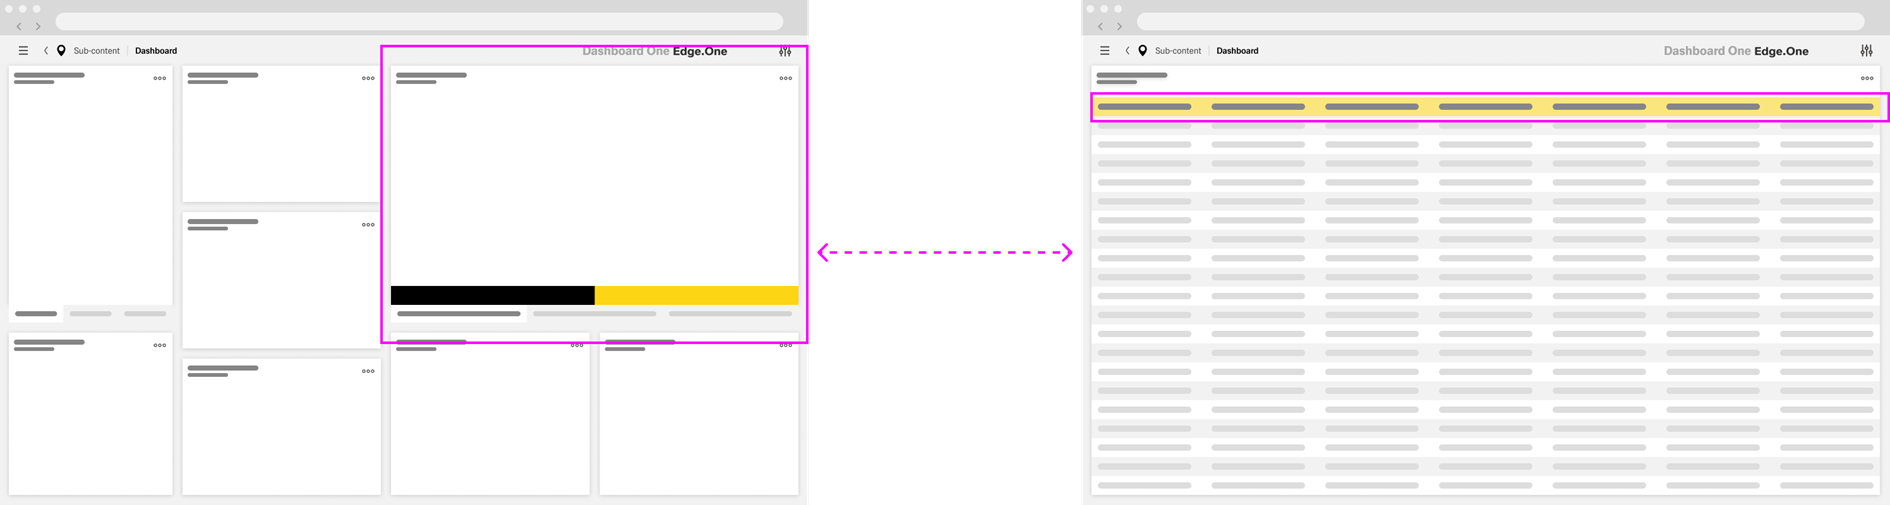
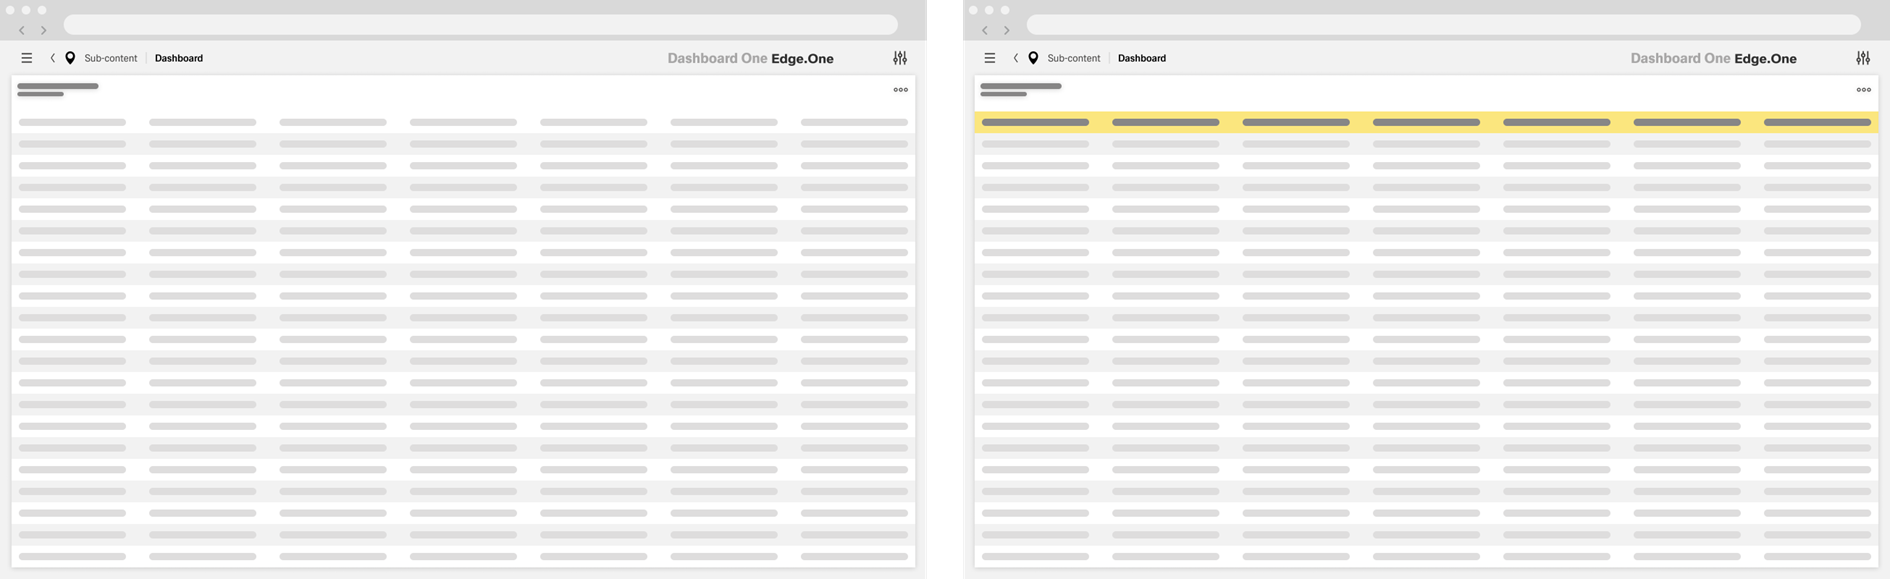
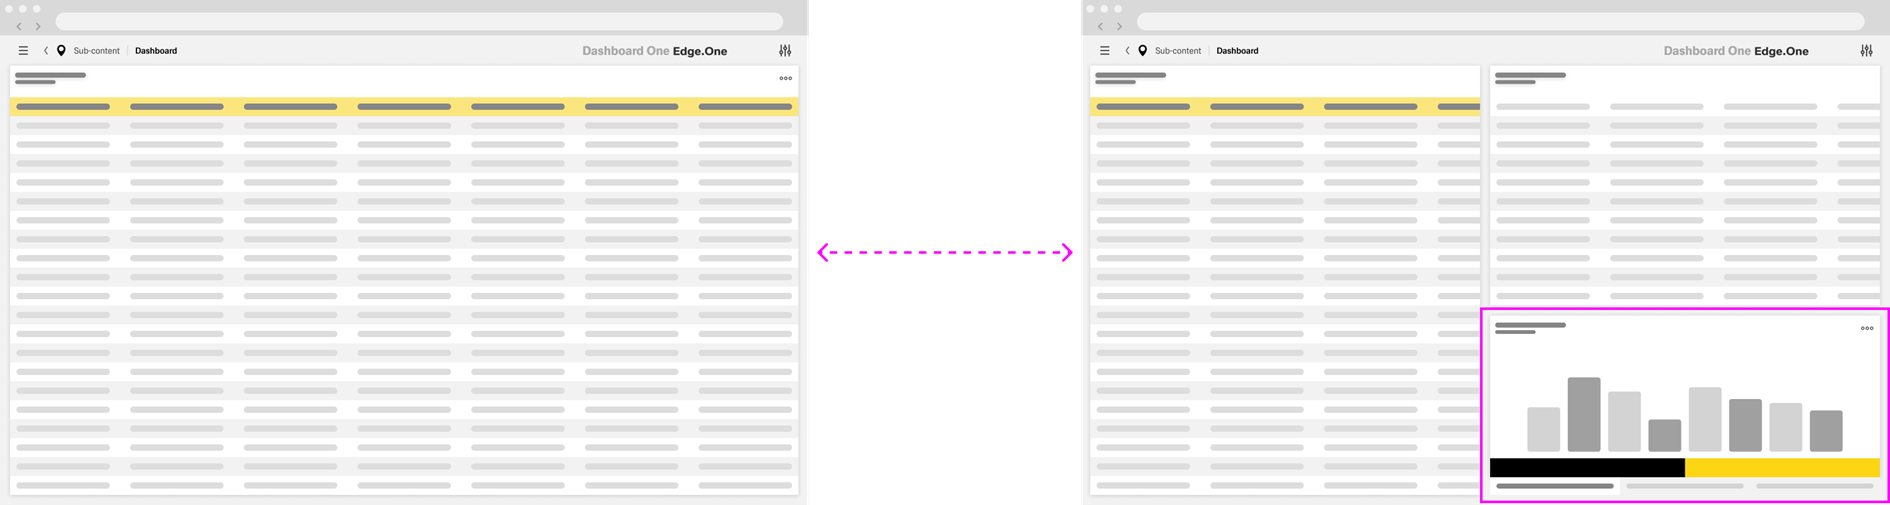
The second dashboard shows the complete list of containers. Certain containers might dynamically be highlighted with the primary color based on criteria like faulty data. Otherwise, this dashboard would not have a primary button, since the next step is the selection of more details. This action applies to every table row thereby can't be a primary action.
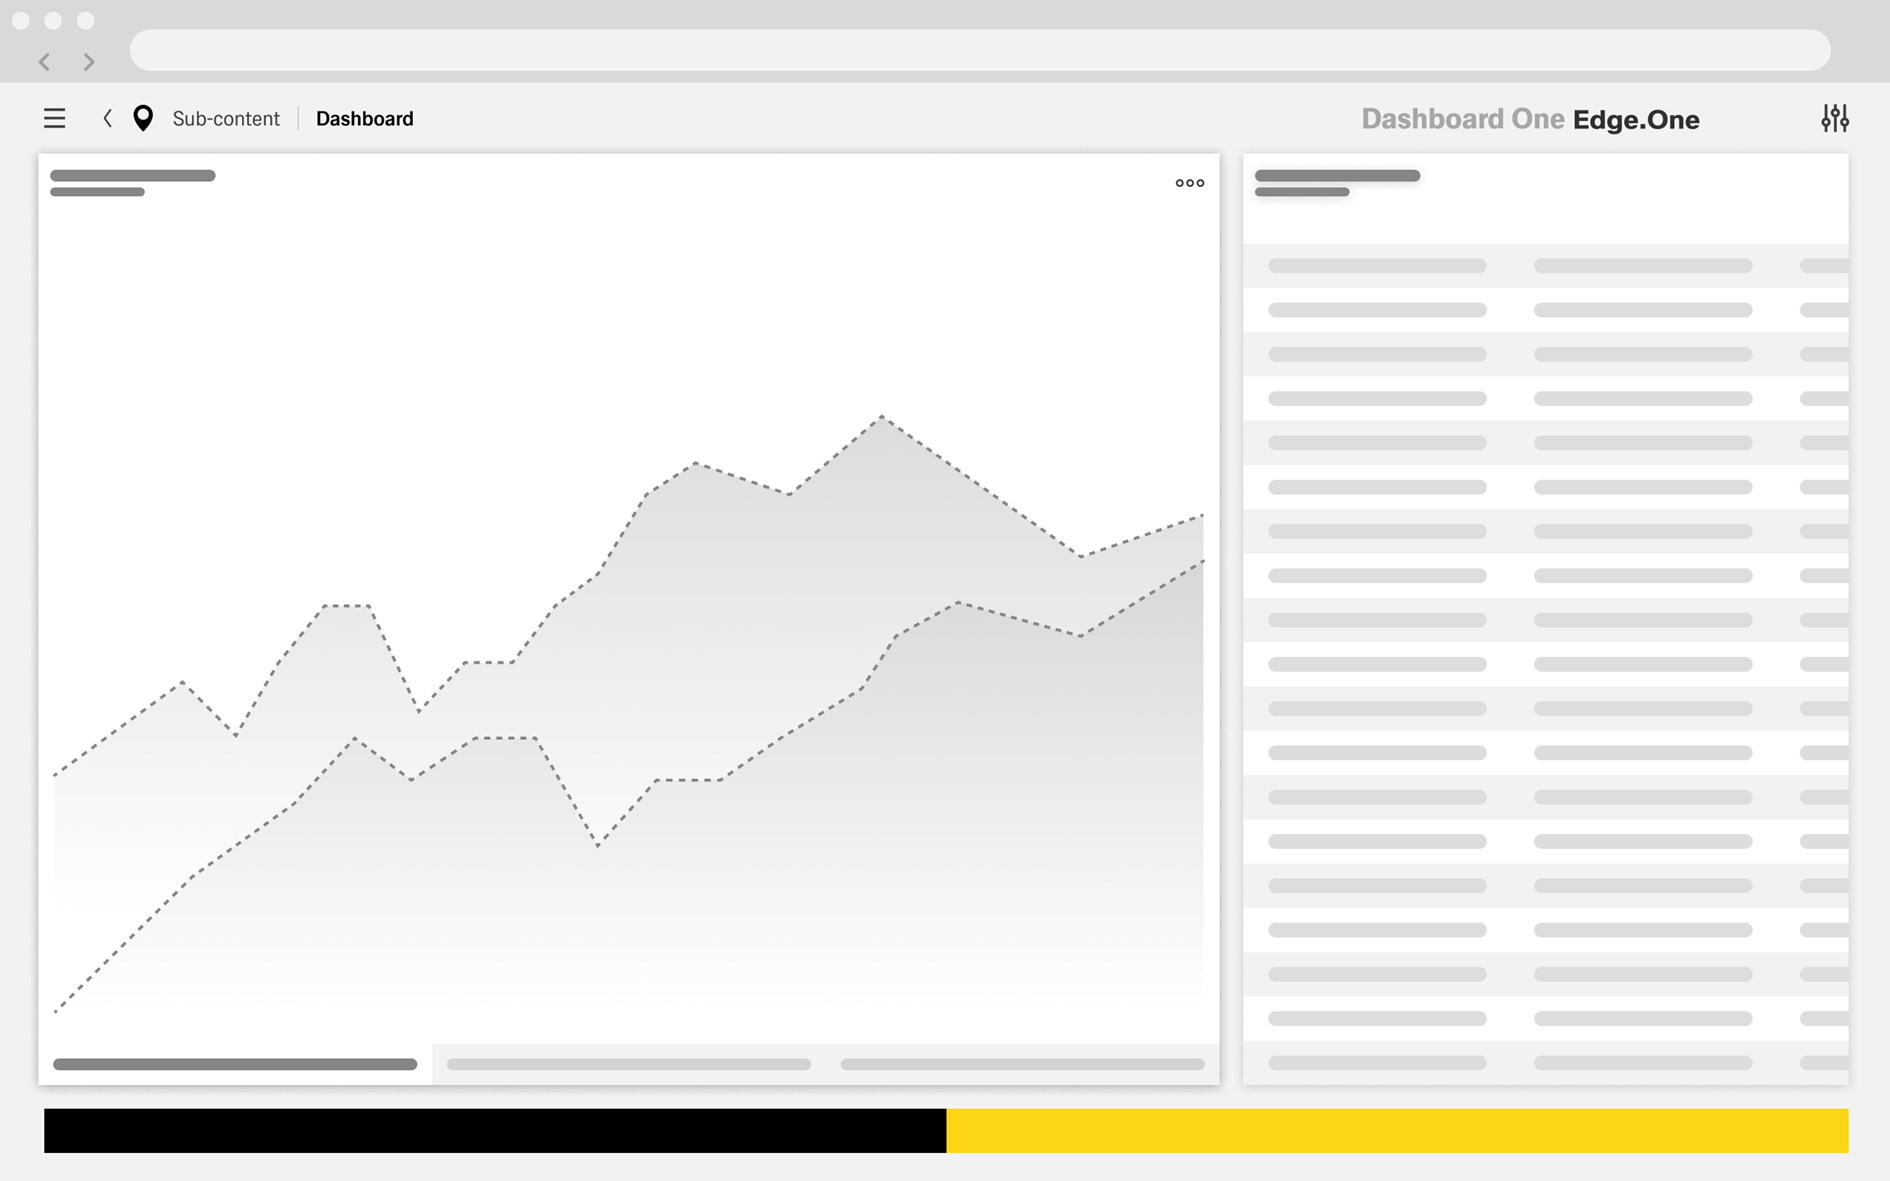
Clicking on a table item shows additional information on the selected container. The bottom of the sidebar contains the data for this container and a chart, with two buttons at the bottom: “Close” and “Edit”. The main task for this dashboard is to navigate to the detail screen in order to edit, making “Edit” the primary action.
The fourth dashboard is a detailed view of the data for the container.
The user can freely edit the data here. The primary action is “Save”, since the system needs a conformation of the changes made by the user.